Interactive Graph Construction
for Graph-Based Semi-Supervised Learning
Changjian Chen1
Zhaowei Wang1
Jing Wu2
Xiting Wang3
Lan-Zhe Guo4
Yu-Feng Li4
Shixia Liu1
1Tsinghua University
2Cardiff University
3Microsoft Research Asia
4Nanjing University
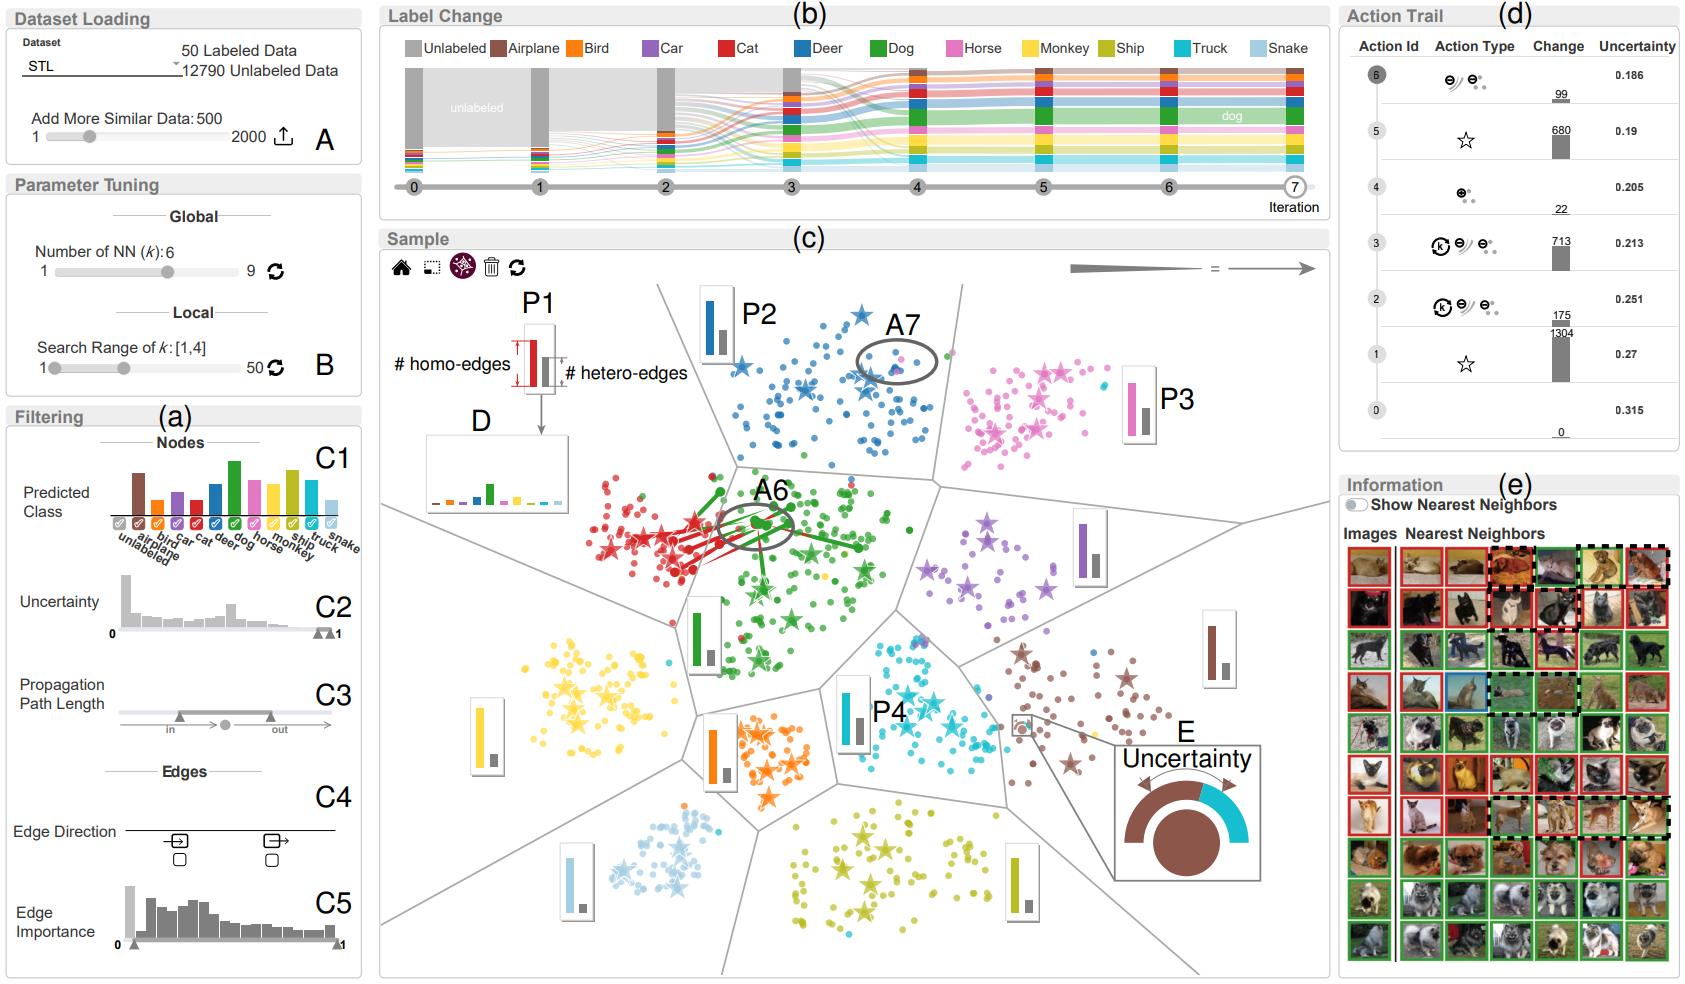
Semi-supervised learning (SSL) provides a way to improve the performance of prediction models (e.g. , classifier) via the usage of unlabeled data. An effective and widely used method is to construct a graph that describes the relationship between labeled and unlabeled data. Practical experience indicates that graph quality significantly affects the model performance. In this paper, we present a visual analysis method that interactively constructs a high-quality graph for better model performance. In particular, we propose an interactive graph construction method based on the large margin principle. We have developed a river visualization and a hybrid visualization that combines a scatterplot, a node-link diagram, and a bar chart, to convey the label propagation of graph-based SSL. Based on the understanding of the propagation, a user can select regions of interest to inspect and modify the graph. We conducted two case studies to showcase how our method facilitates the exploitation of labeled and unlabeled data to improve model performance.
Video: http://datalinker.thuvis.org/Video
Demo: http://datalinker.thuvis.org/Demo
Source Code: https://github.com/chencjgene/SSLVis